Mapping of seabirds along the coast
The distribution of seabirds along the coast of Norway, including Svalbard and Jan Mayen, is mapped in three periods during the year: the breeding season, the moulting period for ducks and the winter season. The goal has been to cover the whole area under Norwegian responsibility in a 10-year cycle. That is to say, that a new mapping cycle is started after ten years. All species are registered, but the focus has been on SEAPOP’s key species.
Systematic counts from sea, air and land
We use several different methods for mapping along the coast. They include everything from visits to localities where total counts are conducted of the birds found there, to conducting counts along transects that systematically cover areas, and where the resulting data is used to model population numbers for the whole area. Counts are conducted from land, boat, car and airplane/helicopter, depending on what is the most expedient for the place and species in question. In some areas several methods are used, in order to compare the numbers.
Some species are so difficult to map during the breeding season that we lack good data for them. In particular, this is the case with certain birds that nest hidden. We do not have good mapping data for the European storm petrel and Leach’s storm petrel, and therefore lack good estimates of their population numbers. The black guillemot and little auk are two other problematic species – they also nest hidden. The same problem occurs with species that have scattered nesting distributions over large areas, such as the northern fulmar and king eider.
The total mapping is also important as it is the basis for comparison with the long-term monitoring. That is to say, routine total mapping can correct for the monitoring that occurs at the key localities.

Photo: Trond Johnsen
Maps and data
Read about the mapping results for
Go directly to the data portal
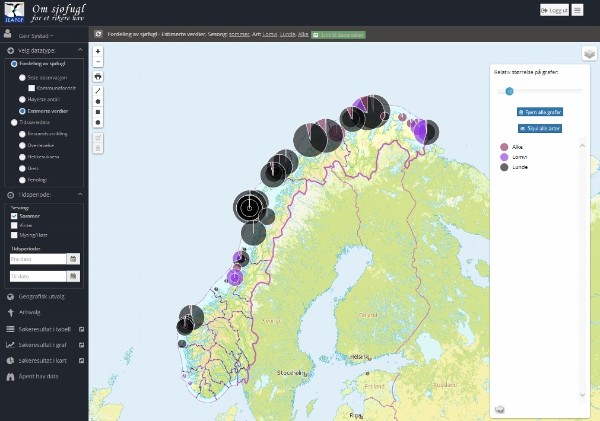
Illustration: SEAPOP